Independent · UK-only · 2026/27 tax year
What will you actually take home?
Straightforward pay calculators for private-sector jobs where pay is complicated — shift premiums, overtime, allowances, agency rates. Real pay data, the 2026/27 tax model, and every figure sourced and dated.
The payslip never matches the advert
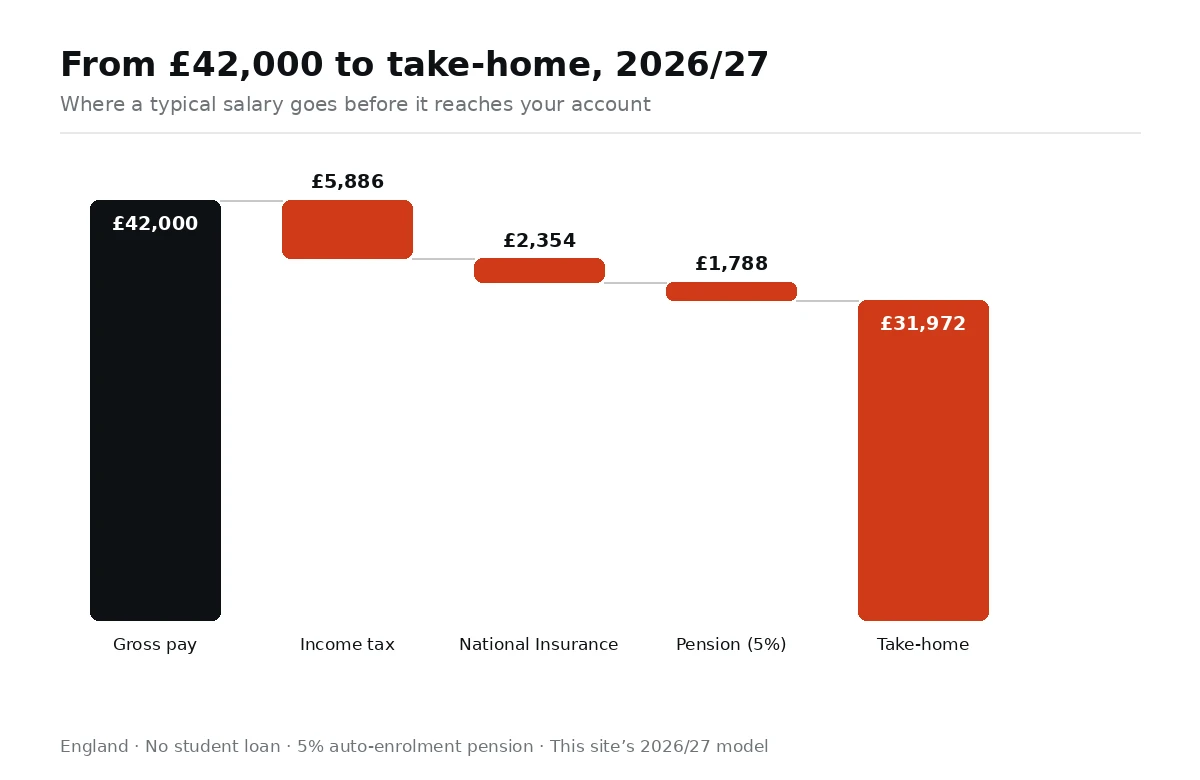
“£42,000 a year” sounds like £3,500 a month. It isn’t — and for jobs with complicated pay, the gap between the advertised figure and the money in your account is where the surprises live.
Take a Class 1 driver on a £42,000 salary. The advert rarely mentions that nights out pay £30 a time, that the night premium adds 15–25% to the hourly rate, or that overtime past 45–48 hours is often paid at 1.5×. Each of those pushes the real annual figure up — and each is taxed, which pulls the take-home back down. The same job can be worth £38,000 or £50,000 depending on the rota, and neither number appears on the job ad.
Armed forces pay works the same way in reverse: the base salary is only the start. X-Factor, specialist pay and a stack of allowances — each with its own rules — sit on top, and the total changes with rank, supplement and increment.
Agency drivers get the sharpest version of the problem. £22 an hour looks generous until you price in the holiday pay, the pension and the weeks with no shifts — then compare it honestly with a permanent salary.
It matters when you’re choosing, too. Two offers ten miles apart can differ by thousands a year once the rota is priced in — the night premium here, the overtime rate there, the allowance the other firm doesn’t pay. The headline salary is the start of the negotiation, not the end of the maths.
That is what these calculators do: they take the messy reality of your pay — premiums, overtime, allowances, agency rates — and run it through the 2026/27 tax model to show the monthly figure that actually lands.
Class 1 · Class 2 · Agency · Nights
Check your HGV take-home pay
Put your salary or hourly rate in and see the monthly figure after tax, National Insurance and pension — with night premiums, overtime and the agency-versus-employed maths, on 2026 rates from the RHA Pay Report.
All HGV driver calculatorsRank · Supplements · Allowances
Work out your military take-home pay
Pick your rank, set your supplement and increment, add the allowances you qualify for — and get the monthly take-home figure that reflects how armed forces pay actually works in 2026/27.
All armed forces calculatorsElectricians · Plumbers · Carpenters · Bricklayers · Painters
Check your construction take-home pay
Day rates, price work and CIS deductions make construction pay the hardest to read in Britain. Pick your trade, run the 2026/27 take-home maths, and see what the 20% CIS deduction really does to your money.
All construction calculatorsCare workers · Senior care workers
Check your care take-home pay
Sleep-ins, travel time between visits and mileage make care pay the hardest payslip in Britain to read. Pick your role, run the 2026/27 take-home maths, and see what the night is really worth.
- Care worker take-home calculator
- Sleep-in and travel pay explained
- Senior care worker take-home calculator
LGV drivers · Warehouse · Delivery · Fork-lift
Check your logistics take-home pay
Tramping allowances, night premiums, per-drop pay and continental shifts make logistics pay impossible to read off a job ad. Pick your role, run the 2026/27 take-home maths, and check the legal hours limits that cap what anyone can earn.
- LGV driver take-home calculator
- Driver hours & overtime explained
- Warehouse operative take-home calculator
Bus drivers · Security · Cleaners · Hospitality · Hair & fitness
Check your services take-home pay
Tips, troncs, split shifts and unsocial-hours premiums make services pay the messiest in Britain — and every extra is taxed differently. Pick your role, run the 2026/27 take-home maths, and see where the money really goes.
- Waiter take-home calculator
- Tips, tronc & unsocial hours explained
- Security guard take-home calculator
What’s inside the maths
Every calculator here runs on one tax model, built for the 2026/27 tax year. That means income tax on the current bands — England’s system and Scotland’s six-band one — with the £12,570 personal allowance and the taper that removes it between £100,000 and £125,140. It means employee National Insurance between the £12,570 primary threshold and the £50,270 upper earnings limit. It means student loan repayments on the right plan — £26,900 for Plan 1, £29,385 for Plan 2, £25,000 for Plan 5, £33,795 for Plan 4, and £21,000 for postgraduate loans — and auto-enrolment pension contributions, because the number that matters is what reaches your account after the pension comes out too.
Thresholds are frozen until April 2031 — the Autumn Budget 2025 decision that quietly drags more people into higher bands every year through fiscal drag. The calculators handle that; you just enter your pay.
Scotland’s six bands are the classic example of why a UK calculator has to ask where you live: the same £40,000 salary is taxed differently north of the border, and the gap widens as pay rises. Set your nation once and every calculator on the site follows it.
One thing the maths can’t do: read your employer’s mind. Salary sacrifice schemes, bonus structures and local shift deals vary workplace to workplace — the results are careful estimates from published rates and the current tax rules, not financial advice. The full workings are on the methodology page, and every dataset is named with its access date on the sources page.
Understand the tax behind your payslip
One tax model sits behind every figure here: 2026/27 income tax bands for England and Scotland, employee National Insurance, student loan thresholds and auto-enrolment pensions — including what is frozen until 2031. Read it once and every payslip makes sense.
Common questions
How accurate are these calculators?
They run the published 2026/27 tax rules against real pay datasets — the RHA Pay Report 2026 for HGV rates, the AFPRB’s 55th Report for military pay — and every figure is checked against gov.uk and stamped with its review date. They’re careful estimates, not financial advice: your employer’s specific schemes can shift the final number.
Why does my colleague take home more on the same salary?
Usually one of four things: Scotland’s tax bands versus England’s, a different student loan plan, pension contributions, or salary sacrifice. Two people on £35,000 can easily differ by £100 a month once those are accounted for — the calculators let you set each one.
Do the calculators handle Scotland’s tax?
Yes. Every income tax calculation runs both systems — England’s bands and Scotland’s six-band structure — and you pick your nation before you calculate.
Do you store my salary?
No. The calculations run in your browser; nothing you type is sent to a server or stored. The privacy page says the same in more detail.
When are the figures updated?
Every page carries a review stamp — currently 24 September 2026. Tax bands update each April; pay datasets update when new reports land, like the annual RHA pay survey and the Armed Forces Pay Review Body report. The pay-rise alerts email covers the big changes.
I’m comparing two job offers — how do I use this?
Run each offer through the matching calculator with its real shift pattern — nights, overtime, allowances — not just the headline salary. A £40,000 job with regular overtime at 1.5× can beat a £44,000 job without it once tax is applied. The agency-versus-employed comparison is built for exactly this kind of maths.
Check the numbers yourself
Trust is earned, not claimed. Every pay dataset is named on the sources page with the date it was accessed — the RHA Pay Report 2026, the AFPRB’s 55th Report, HMRC and ONS publications. Every calculator page carries a review stamp showing when its figures were last checked. And the methodology page explains the tax model in full: which bands, which thresholds, what’s frozen and until when.
If a figure looks wrong, the contact page is there for corrections — with the source, if you have one. We’d rather fix a number than defend it.
Get the 2027 pay-rise alerts
Pay scales move every April. We email once when the numbers change — no spam, no selling your address, unsubscribe any time.
Double opt-in: you will get a confirmation email before anything is sent.